What's included?
dashboards
1
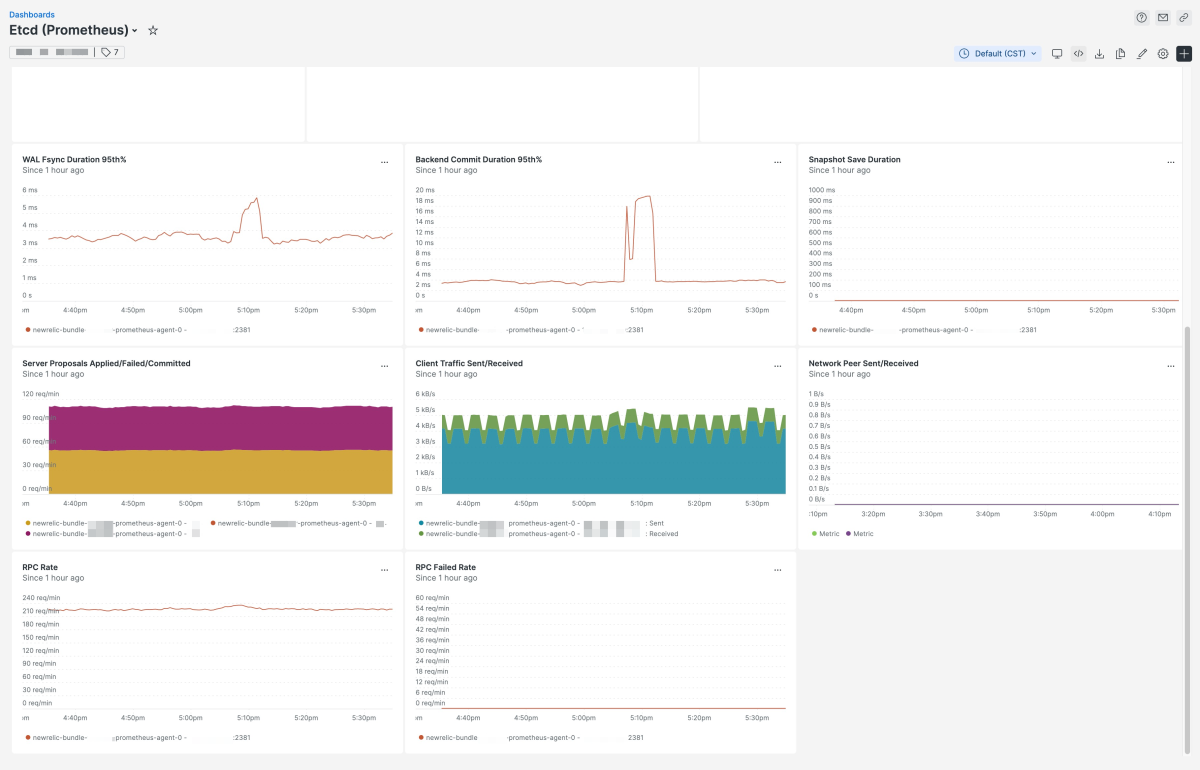
Etcd (Prometheus) quickstart contains 1 dashboard. These interactive visualizations let you easily explore your data, understand context, and resolve problems faster.
Etcd (Prometheus)
alerts
6
Etcd (Prometheus) observability quickstart contains 6 alerts. These alerts detect changes in key performance metrics. Integrate these alerts with your favorite tools (like Slack, PagerDuty, etc.) and New Relic will let you know when something needs your attention.
Higher Number Of Failed GRPC requests
This alert is triggered when more than 5 gRPC requests are failing in last 5 minutes
Number Of Failed Server Proposals
This alert is triggered when more than 5 proposals are failing in last 5 minutes
No Leader
This alert is triggered when the etcd member has no leader
Leader Changes
This alert is triggered when more than 3 leader changes occured
Latency Of Fsync Called By Wal
This alert is triggered when fsync durations are high in an instance
High Commit Duration
This alert is triggered when commit duration is high in instance
documentation
3
Etcd (Prometheus) observability quickstart contains 3 documentation reference. This is how you'll get your data into New Relic.
What is Etcd?
Etcd is a strongly consistent, distributed key-value store that provides a reliable way to store data that needs to be accessed by a distributed system or cluster of machines. It gracefully handles leader elections during network partitions and can tolerate machine failure, even in the leader node
Quickstart details
This quickstart was built based on Etcd metrics sent to New Relic through remote write configurations with Prometheus Agent or Prometheus server.


